An estimation of water origins in the vicinity of a tropical cyclone’s center and associated dynamic processes
To clarify the time evolution of water origins in the vicinity of a tropical cyclone (TC)’s center,
we have simulated Typhoon Man-yi (July 2007) in our case study, using an isotopic regional spectral model.
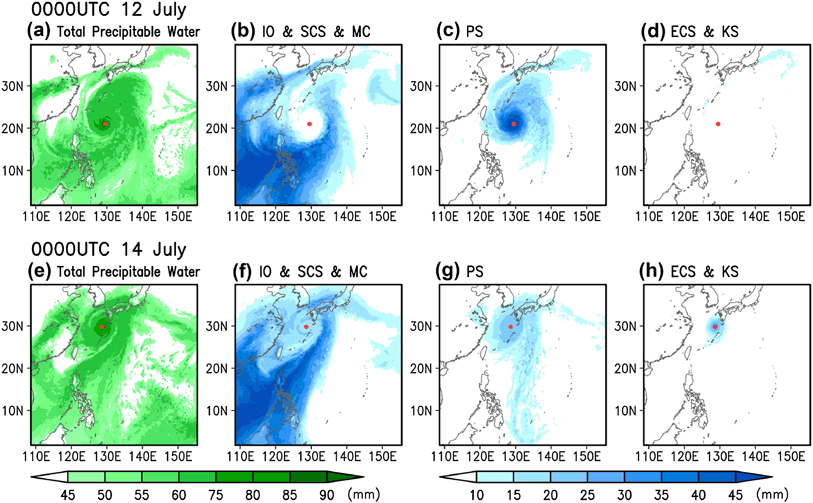
The model results confirm that the replacement of water origins occurs successively as the TC develops and migrates northward over the western North Pacific.
It is confirmed that, in this case, a significant proportion of total precipitable water around the cyclone center comes from external regions rather than the underlying ocean during the mature stage of a TC.
Similar features can also be seen in the proportion of each oceanic origin to total condensation. Indian Ocean, South China Sea,
and Maritime Continent water vapors begin to increase gradually at the developing stage and reach their peak at the decay stage when the TC approaches southwestern Japan.
These remote ocean vapors are transported to the east of the cyclone via the moisture conveyor belt,
a zone characterized by distinct low-level moisture flux that stretches from the Indian Ocean to the TC,
and are further supplied into the inner region of the TC by inflow within the boundary layer associated with its secondary circulation.
Since it takes time to undergo these two dynamic processes, the delayed influence of remote ocean vapors on the TC appears to become evident during the mature stage.
熱帯低気圧中心近傍の水蒸気起源の時間発展を明らかにするために、領域同位体循環モデルを用いて台風Man-yi (2007)の再現実験を行った。
シミュレーション結果から、台風が発達しながら西部北太平洋を北進するにつれて水蒸気起源の連続的な交替が生じていることが見出された。
本事例では、台風の最盛期には、台風直下の海洋よりもむしろ台風システムの外側の海域からの水蒸気が台風中心近傍の全可降水量に実質的な寄与をしていることが確認された。
また、台風中心近傍の全凝結量に対する各海域起源水蒸気の凝結量の割合にも類似の傾向がみられた。
インド洋・南シナ海・海洋大陸起源の水蒸気量は台風の発達期に次第に増加し、台風が西南日本に接近した衰退期に極大に達していた。
これらの遠隔海域起源の水蒸気は、水蒸気コンベアベルト(インド洋から台風に延びる水蒸気フラックスが顕著なベルト)経由で台風の東側まで輸送され、
さらに台風の2次循環と関連する境界層内のインフローによって台風の内部領域に供給される。
これら2つの力学過程で時間を費やすため、台風に与える遠隔海域起源の水蒸気の影響は遅延し、台風の最盛期に顕在化してくると考えられる。
*Please refer to the following manuscript.
*詳細は下記論文を参照してください。
Takakura, T., R. Kawamura, T. Kawano, K. Ichiyanagi, M. Tanoue, and K. Yoshimura (2017):
An estimation of water origins in the vicinity of a tropical cyclone’s center and associated dynamic processes.
Climate Dynamics, doi: 10.1007/s00382-017-3626-9.
